
Powerful features for smarter investment decisions
Everything you need to track, analyse and act on market-moving information, in one screen.
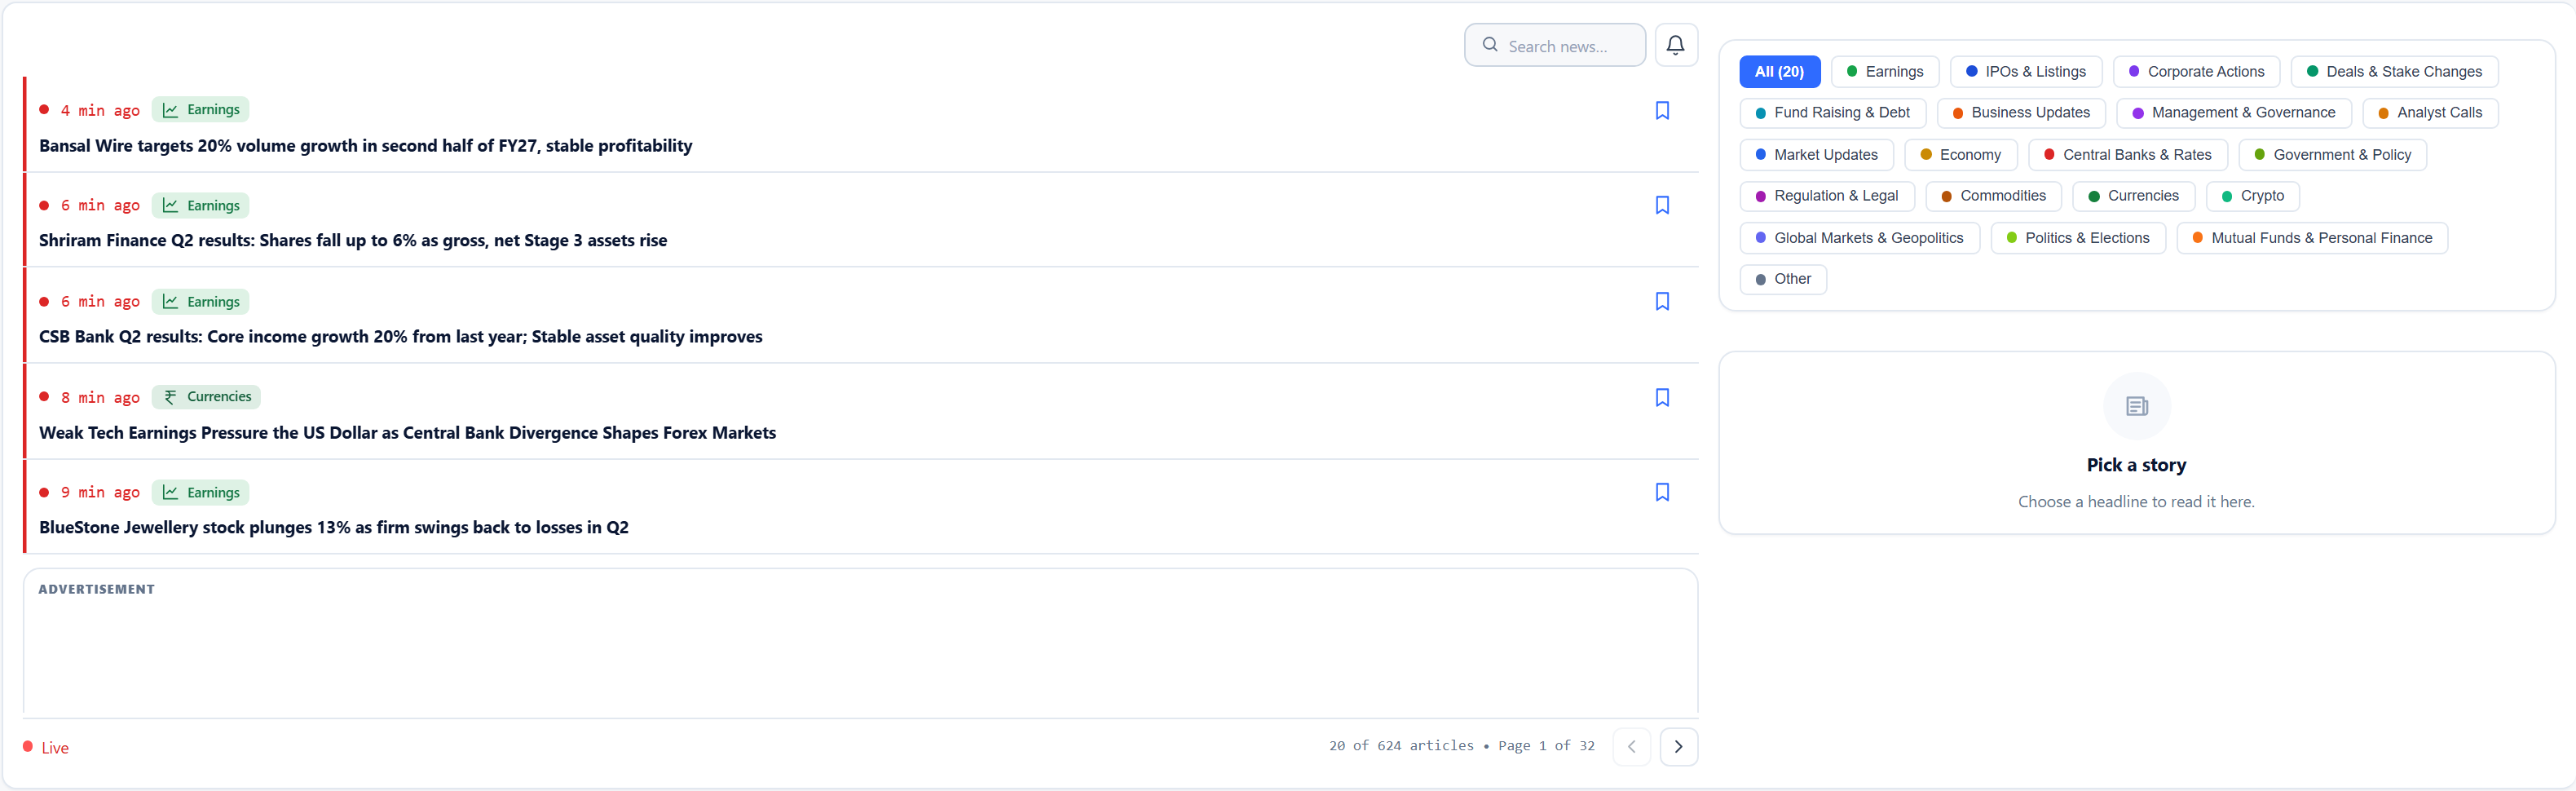
News Feed
Real-time market news from multiple sources, categorised into 19 categories so you can see exactly what matters to you.
- Live, 15-minute and 24-hour filters
- 19 categories: Earnings, IPOs, Deals, Central Banks, Commodities and more
- Bookmarks, and desktop notifications for fresh stories that bring you straight back to them
Market Pulse
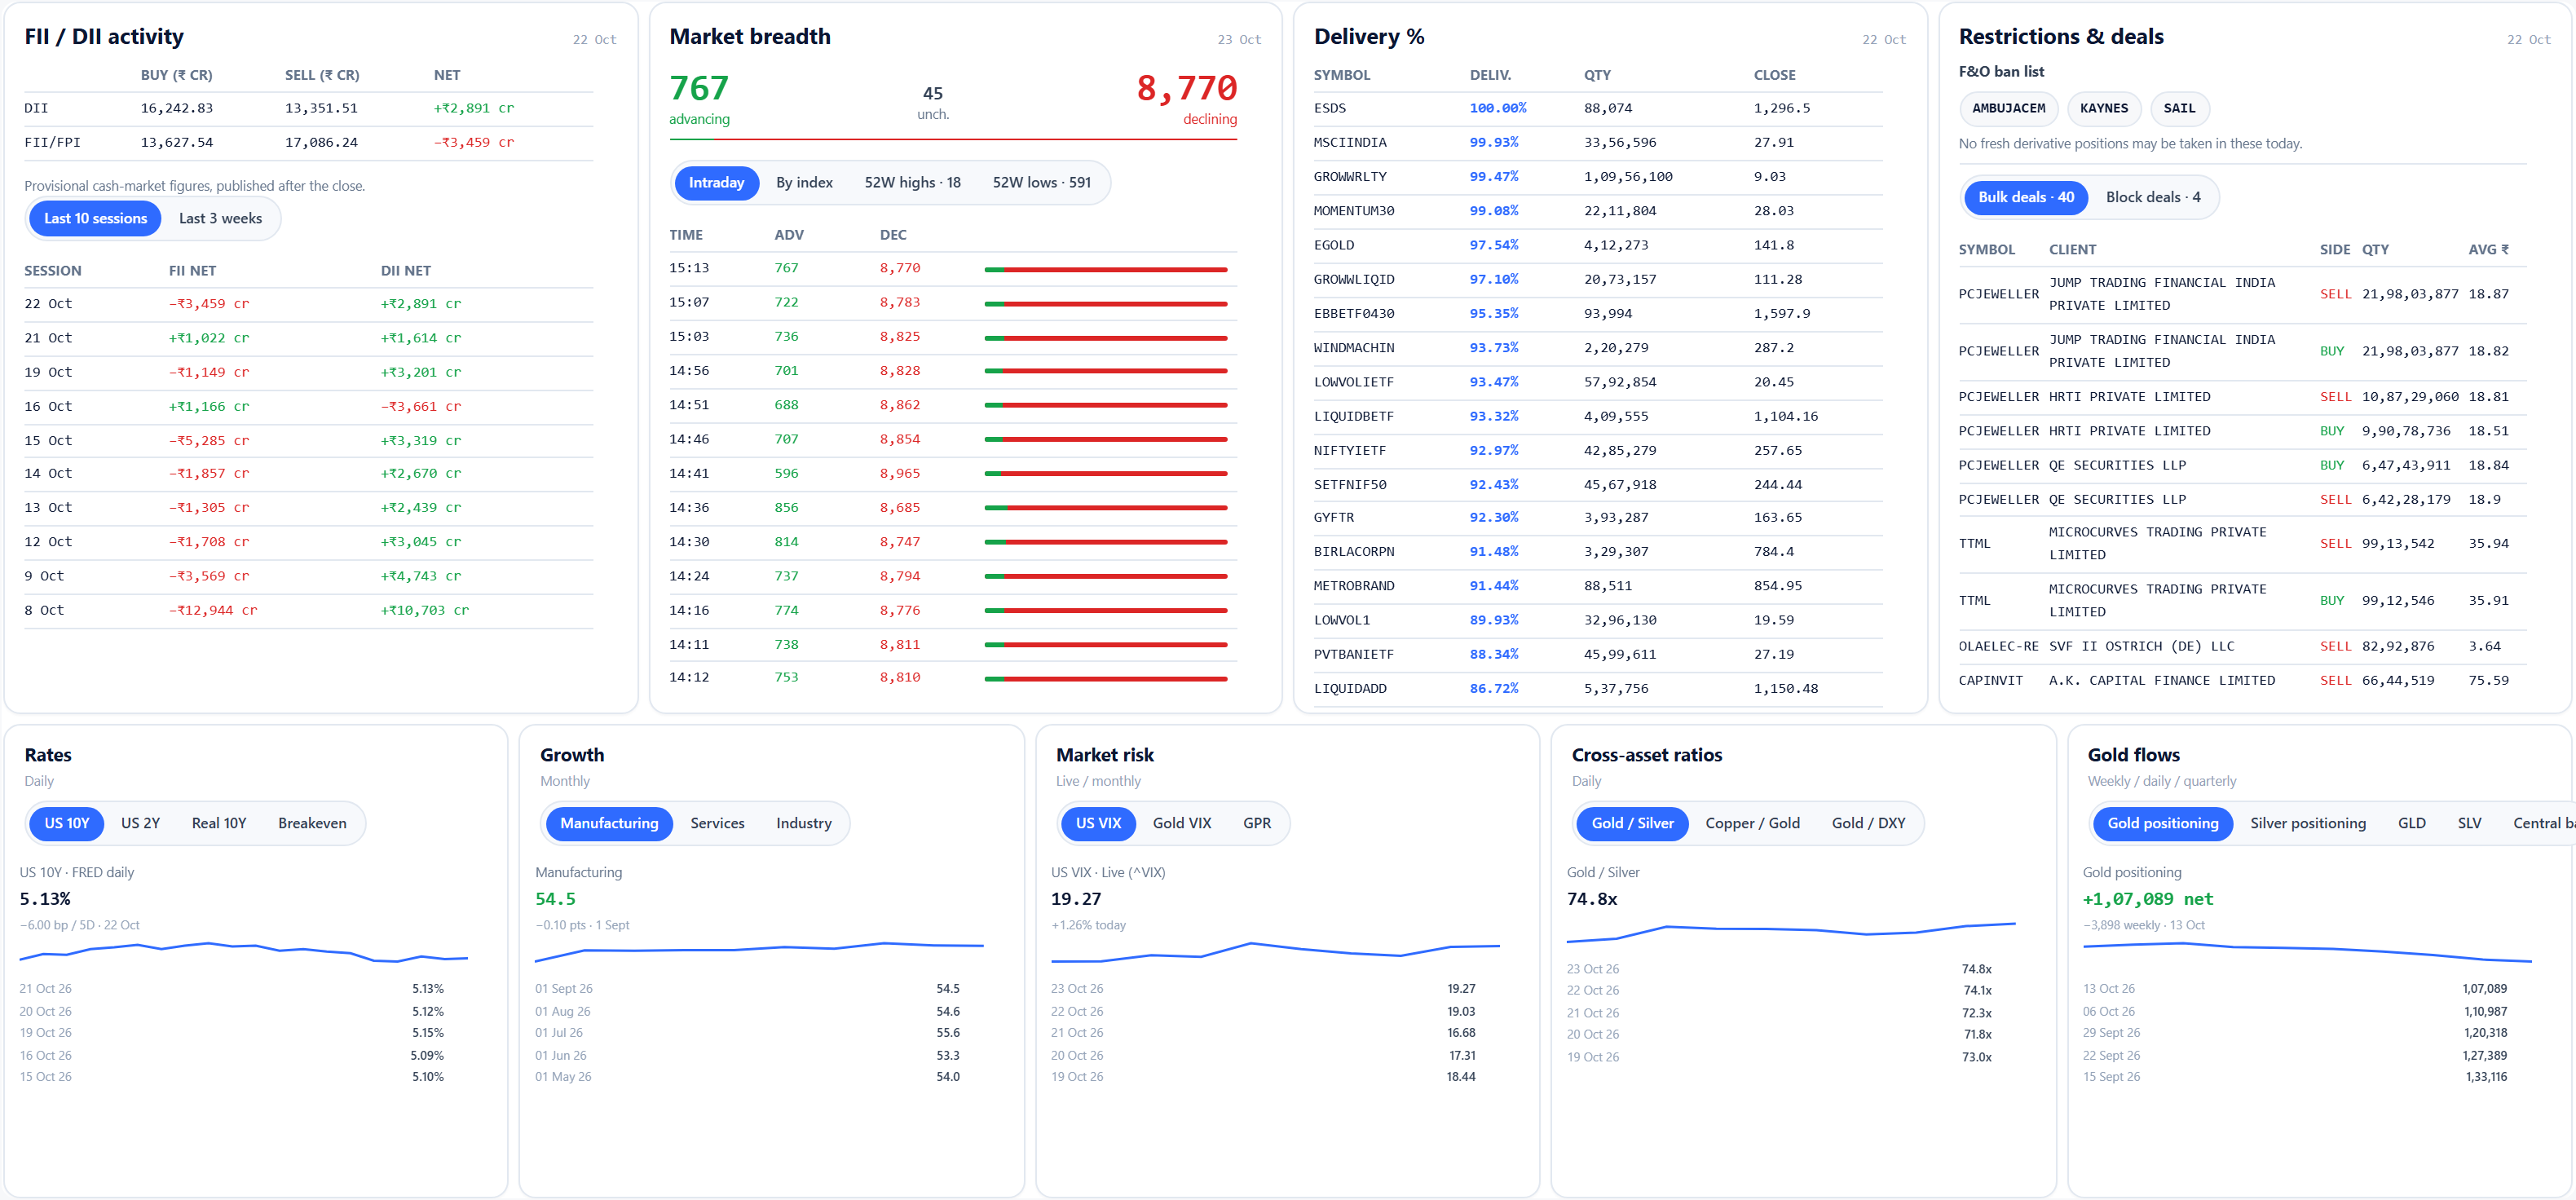
NSE activity comes first, with global rates, risk, positioning and demand underneath for context.
- FII/DII cash flows, breadth, delivery, F&O bans and bulk and block deals
- Rates, volatility, PMI, geopolitical risk, positioning, ETF holdings and demand
- Overview snapshot plus recent history in independently scrollable cards
Hot Topics
The ten topics moving the market right now, picked from how many outlets carry them, how fast they're growing and how unusual the attention is.
- Rising and unusual-volume flags at a glance
- Why it matters, bullish or bearish sentiment, related tickers and supporting stories
- Now, 7-day and 30-day views that merge repeated coverage of the same topic

Search any ticker
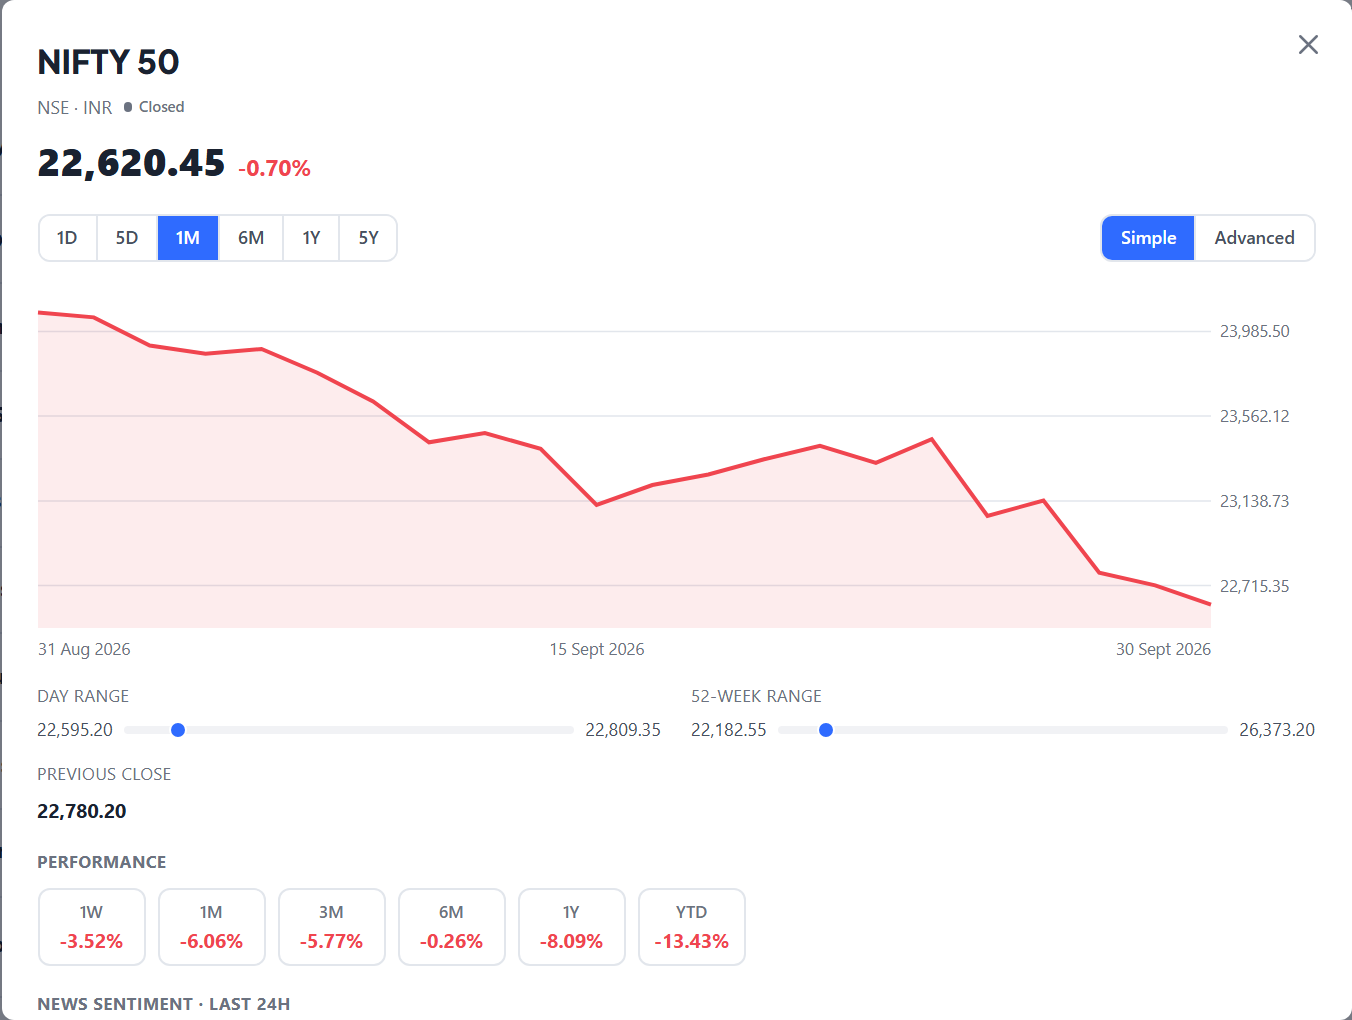
Type a name or a symbol in the header — Nifty, INFY, Gold, Bitcoin — and open it straight away: its chart, its day and 52-week range, its returns and the stories behind the move.
- Every instrument on My Market Desk: stocks, indices, commodities, currencies, crypto and bonds
- Whether or not it is one of your price tickers
- Charts, news, sentiment and upcoming events for everyone
AI analysis
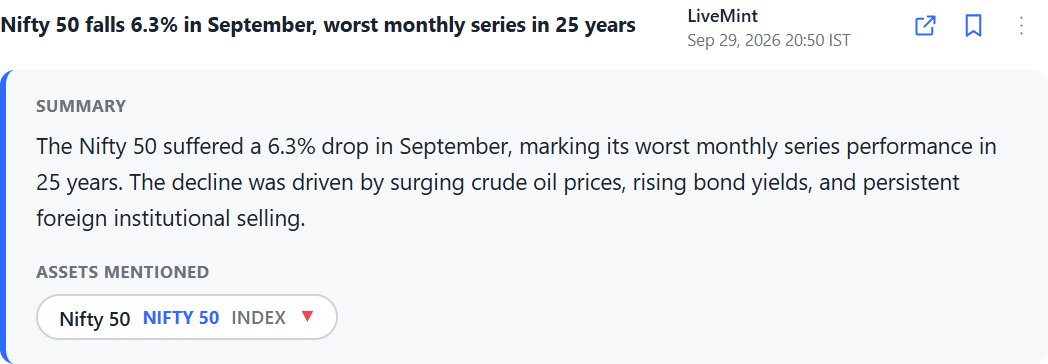
Open any headline for a two-line summary, the stocks and assets it's really about, and the dates it mentions.
- Two-sentence summary of the article
- Companies, indices and commodities it covers, with sentiment
- Events and dates pulled out for you
Event Calendar
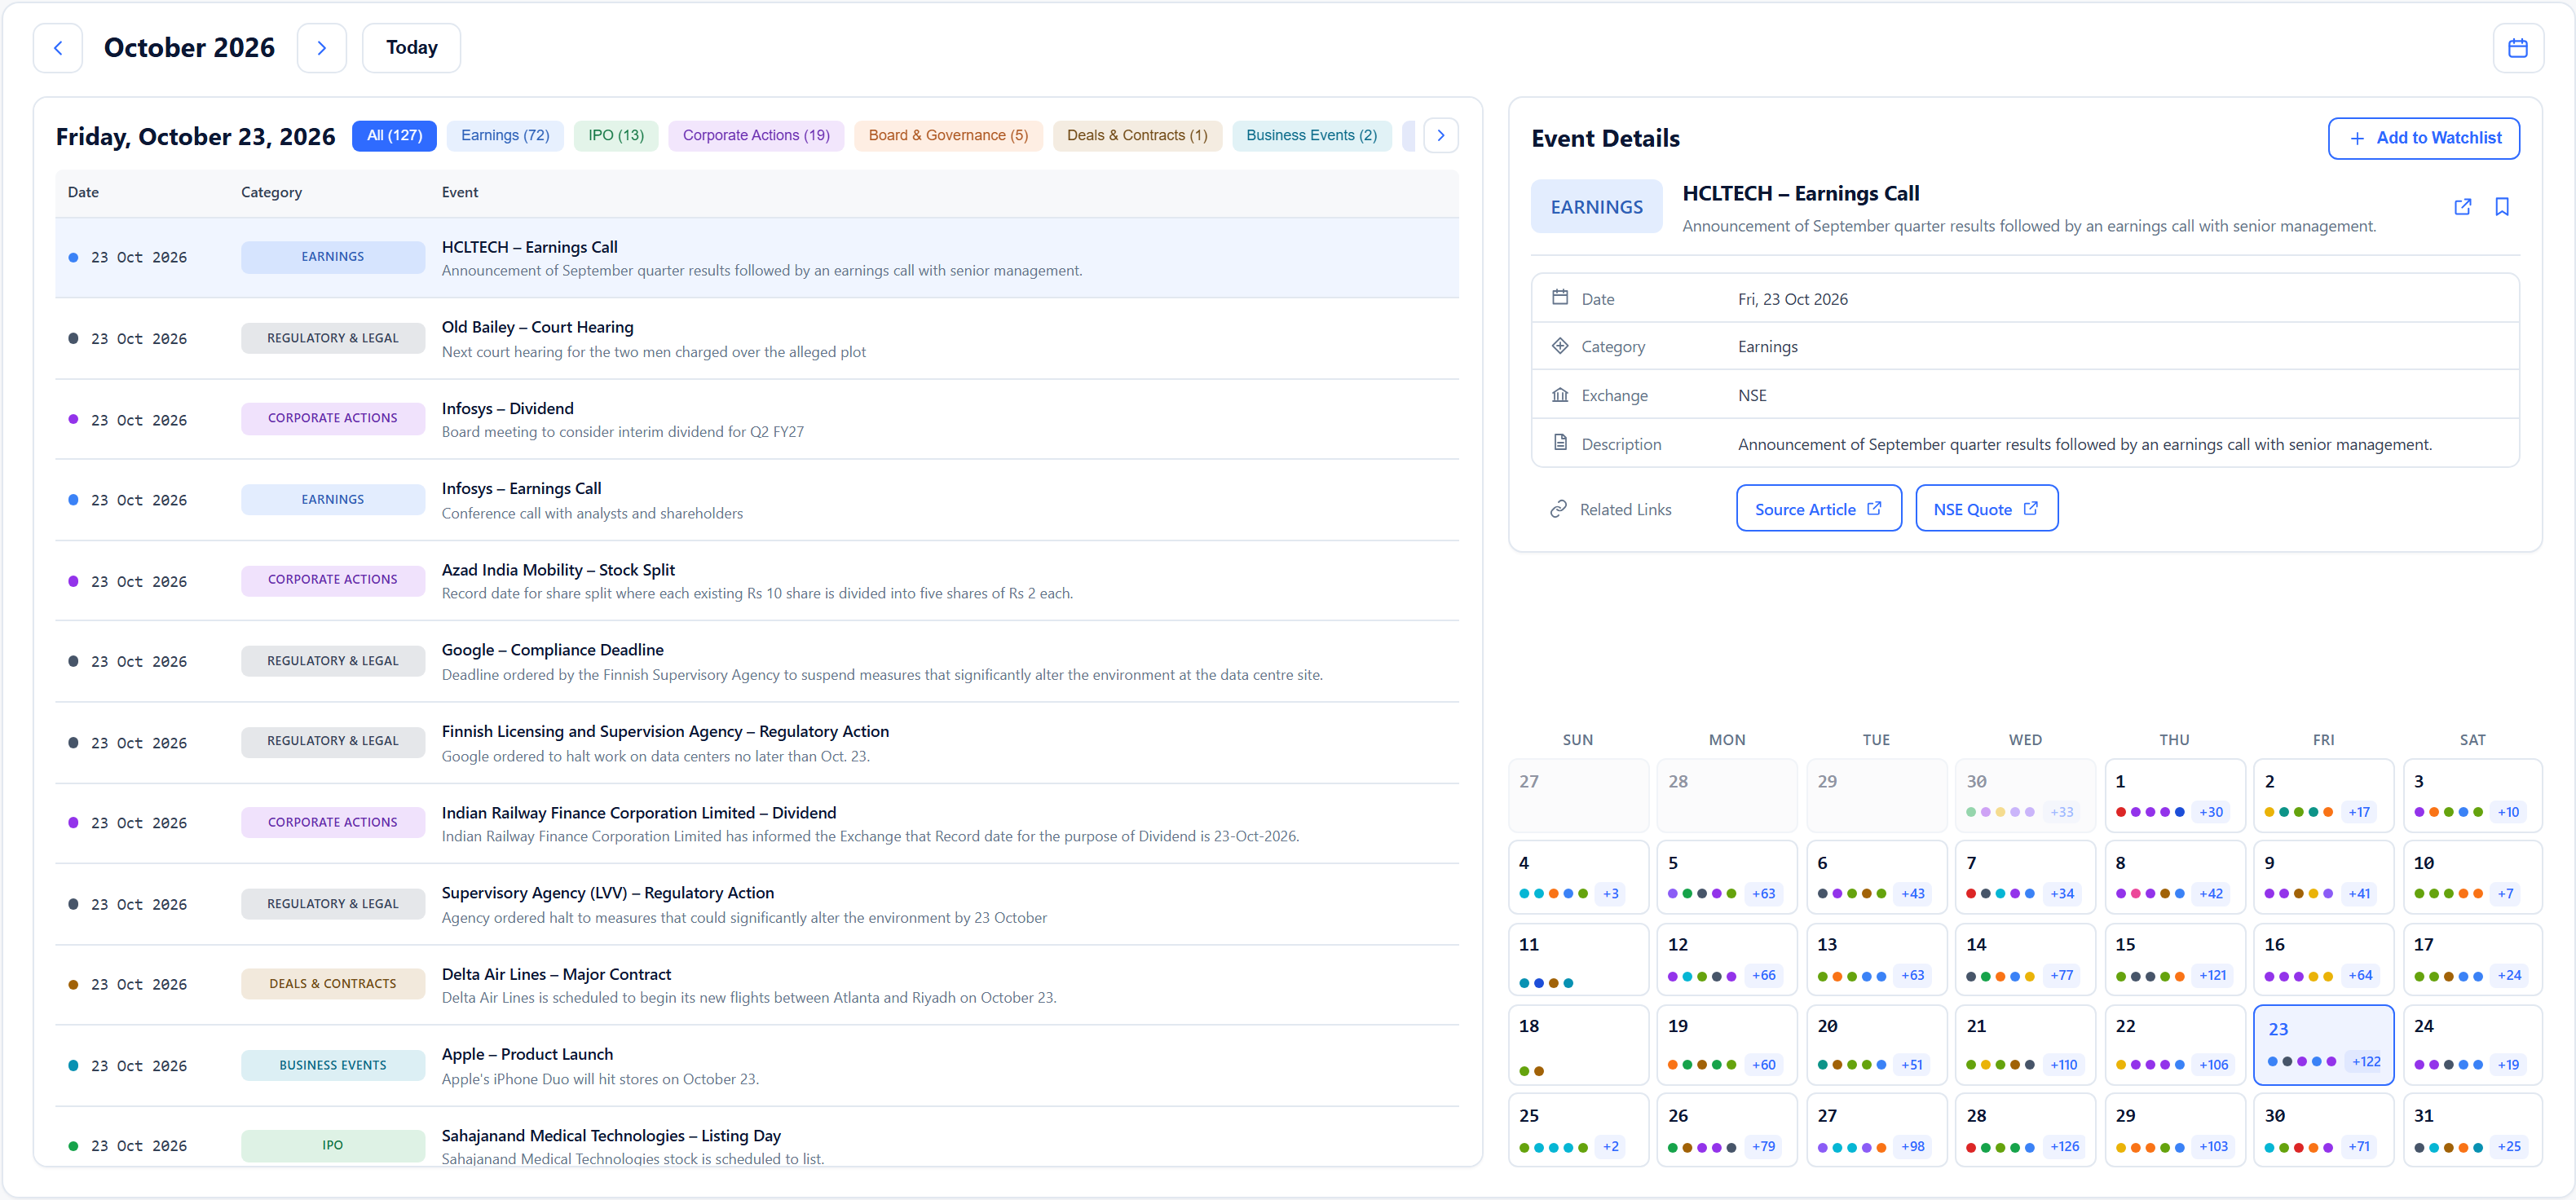
Track earnings, IPOs, corporate actions, RBI meetings and economic data, colour-coded in a month view with the day's details.
- Month view with every event type in its own colour
- Event details with the source filing or article
- Save events to your watchlist and export them to your calendar
Price tickers and charts
Everyone starts with 15 essential benchmarks. Sign in to add 10 personal picks on Free or 35 on Pro; your choices are saved to your account and shown after the fixed set.
- Charts from one day to five years, as a line or candlesticks with volume
- Day and 52-week ranges, and returns over 1 week to 1 year and year to date
- Whether each market is open, closed or about to open
- The ticker's news, sentiment, upcoming events and "Why is it moving?"
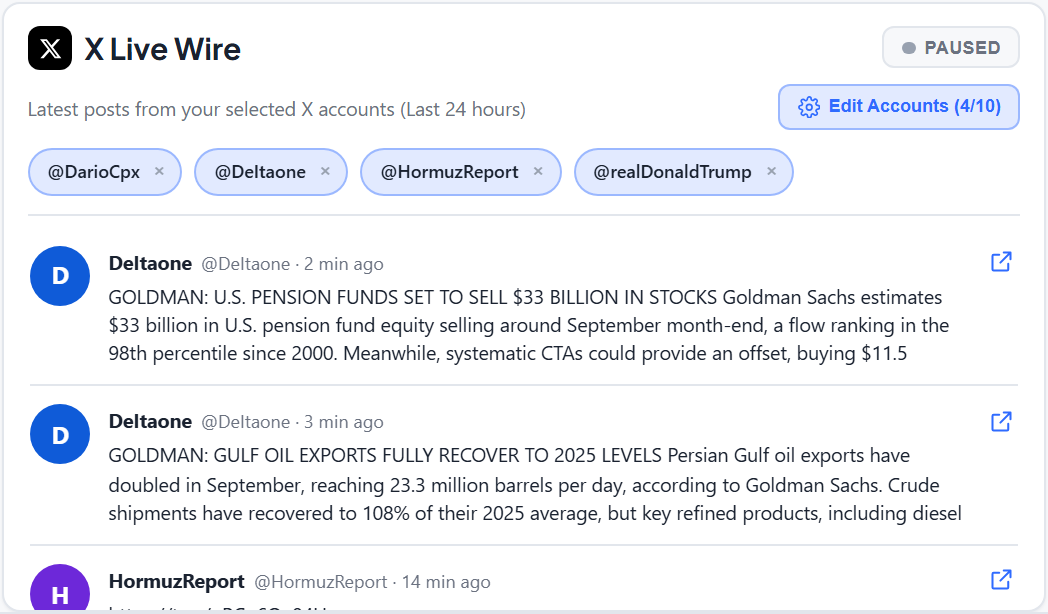
X Live Wire PRO
Follow the X accounts that move your markets and see their posts stream in next to your news, as they happen.
- Choose your own accounts: 5 on Pro
- Add or remove them any time from Manage X Accounts
- The last 24 hours at a glance, newest first
Made for your screen
From a phone on the go to a big trading monitor.
Display size
Small, Medium, Large or Extra large on laptops and monitors: fit more on screen, or read it bigger.
Notifications
A desktop notification for each fresh story. Click it to jump back to it in your feed.
Light or dark
Switch themes any time, and use it on your phone with the same account.
What we're building next
These are on our roadmap and not available yet.
Screener
Find opportunities with fundamental and technical filters.
Alerts
Get notified about price levels, keywords, companies and events you care about.
Try it free
The full News Feed, Hot Topics, Market Pulse, AI analysis, Event Calendar and 25 price tickers are free.